Effect #071 in our rendered series
Line graph draw-on
Two sample lines draw on, dots pop at each point and value labels ride the drawing edge.
Rendered by us at 1920x1080 over a shot from Tears of Steel (Blender Foundation, CC-BY 3.0). Expand plays the full 1080p file.
Edit in Premiere, Resolve or After Effects? Jump to editor templates. Making many versions of the same video? Use the code route.
Make this effect with
Built and tested by us
Other ways, not tested by us
Use it in a real edit
The demo above already plays the composition over real footage: the clip is a muted <video> layer under the graphics (the file plate.mp4 in the code below). Replace that file with your own clip and render again. To use the graphics in an editor instead, switch the background off and render a transparent MOV (an H.264 MP4 cannot carry transparency):
npx hyperframes render . -o overlay.mov --format mov --fps 24 --variables '{"plate":false}'The routes in full
With Claude Code: the prompt we used
Rendered and tested by us in HyperFrames 0.8.10 on Nov 14, 2026.
Write a HyperFrames line graph where one or two lines draw on, dots pop at each point, and value labels follow the drawing edge. Make the line colours and the second series a variable.
What changed since this prompt: the demo on this page is our second version, 5 seconds long, rebuilt on a shot from Tears of Steel with the same animation idea. The full composition below is the one we rendered; its build log lists every change.
Built by a Claude Code subagent (Sonnet) from the HyperFrames registry block mk-line-graph, HyperFrames 0.8.10. Claude Code then checked the composition with hyperframes lint and hyperframes check before we rendered it.
What we had to correct (7 notes from the build log):
- 6 Nov 2026, lint 1: 0 errors, 0 warnings.
- Adapted from mk-line-graph: kept the stroke-dashoffset draw-on, dots popping as the front reaches each point and the value label riding the front. Changed: straight polyline segments timed by length so the label tweens per segment stay in exact step with the line (no onUpdate), a panel behind the axes so text always sits on a known background, two series with a colour-dot legend, baseline axis and x labels ("Point 1" to "Point 7"), all values are clearly sample.
- Labels read "Sample value" in a dark pill with a coloured border (white text on the series colour would fall under 4.5:1 for the default orange). Series A labels sit above the point and series B below so they cannot collide.
- Variables: the brief listed four; a fifth enum, "Data shape" (gentle or steep), was added because the steep variation needs a data switch.
- The chart (lines, dots, labels) fades at 4.5 s so the loop restarts on the bare axes.
- hyperframes check: "Check passed", 0 errors, 0 warnings, 18 info items. Render: flash check passed. Looked at 1920 px frames at 1.2 s, 2.4 s and 3.8 s: lines draw with dots behind the draw front and a value pill riding each tip; at 3.8 s both lines are complete and the pills sit inside the panel.
- v2 (14 Nov 2026): first render. Every number on screen comes from our own measured test results (labelled Measured by us, 2026); frames and the poster were checked by eye.
With HyperFrames code
Rendered and tested by us in HyperFrames 0.8.10 on Nov 14, 2026.
npx hyperframes add mk-line-graph
npx hyperframes render . -o out.mp4 --fps 24
Settings you can change without rebuilding (pass them with --variables):
| Setting | Name | Type | Default |
|---|---|---|---|
| Series 1 colour | color1 | color | #ff7a45 |
| Series 2 colour | color2 | color | #4da3ff |
| Show second series | showSecond | boolean | true |
| Data shape | data | enum | gentle |
| Show background | plate | boolean | true |
Our full composition (index.html, 11 KB)
<!doctype html>
<html lang="en" data-composition-variables='[{"id":"color1","type":"color","label":"Series 1 colour","default":"#ff7a45"},{"id":"color2","type":"color","label":"Series 2 colour","default":"#4da3ff"},{"id":"showSecond","type":"boolean","label":"Show second series","default":true},{"id":"data","type":"enum","label":"Data shape","default":"gentle","options":[{"value":"gentle","label":"Gentle"},{"value":"steep","label":"Steep jumps"}]},{"id":"plate","type":"boolean","label":"Show background","default":true}]'>
  <head>
    <meta charset="UTF-8" />
    <meta name="viewport" content="width=1920, height=1080" />
    <link href="https://fonts.googleapis.com/css2?family=Inter:wght@700&display=block" rel="stylesheet" />
    <script src="gsap.min.js"></script>
    <style>
      *, *::before, *::after { box-sizing: border-box; margin: 0; padding: 0; }
      html, body { width: 1920px; height: 1080px; overflow: hidden; background: transparent; }
      #root { position: relative; width: 100%; height: 100%; overflow: hidden; background: transparent; }

      #plate { position: absolute; inset: 0; background: radial-gradient(120% 90% at 30% 40%, #1b2335 0%, #0b0d12 70%); overflow: hidden; }
      #world { position: absolute; left: -200px; top: -120px; width: 2400px; height: 1320px; }
      .blob { position: absolute; border-radius: 50%; filter: blur(60px); }
      .b1 { width: 760px; height: 760px; left: 180px; top: 260px; background: #ff5a1f; opacity: 0.35; }
      .b2 { width: 900px; height: 900px; left: 1200px; top: 80px; background: #2f6bff; opacity: 0.45; }
      .grid { position: absolute; inset: 0; background-image: linear-gradient(rgba(255,255,255,0.05) 1px, transparent 1px), linear-gradient(90deg, rgba(255,255,255,0.05) 1px, transparent 1px); background-size: 120px 120px; }

      #panel { position: absolute; left: 130px; top: 80px; width: 1660px; height: 920px; border-radius: 36px; background: rgba(11,15,25,0.94); border: 2px solid rgba(255,255,255,0.16); z-index: 4; box-shadow: 0 30px 80px rgba(0,0,0,0.45); }
      #ttl { position: absolute; left: 190px; top: 122px; z-index: 6; font-family: "Inter", sans-serif; font-weight: 700; font-size: 40px; line-height: 48px; color: #ffffff; }
      #legend { position: absolute; right: 190px; top: 122px; z-index: 6; display: flex; gap: 40px; align-items: center; height: 48px; }
      .lg { display: flex; align-items: center; gap: 14px; font-family: "Inter", sans-serif; font-weight: 700; font-size: 28px; color: #e2e8f0; }
      .lg i { display: block; width: 22px; height: 22px; border-radius: 50%; }
      #chart { position: absolute; inset: 0; width: 100%; height: 100%; z-index: 7; }
      .xl { position: absolute; z-index: 6; width: 200px; text-align: center; top: 826px; font-family: "Inter", sans-serif; font-weight: 700; font-size: 26px; line-height: 34px; color: #cbd5e1; }
      .dot { position: absolute; z-index: 9; width: 24px; height: 24px; border-radius: 50%; border: 4px solid #0b0f19; }
      .pill { position: absolute; z-index: 10; width: 210px; height: 52px; border-radius: 26px; background: #05070b; border: 3px solid; display: grid; place-items: center; font-family: "Inter", sans-serif; font-weight: 700; font-size: 24px; color: #ffffff; opacity: 0; }


      /* footage plate (v2): real footage, pinned, no generated blobs */
      #plate { background: #000 !important; }
      #world { left: 0 !important; top: 0 !important; width: 1920px !important; height: 1080px !important; transform: none !important; }
      #world .blob, #world .grid { display: none !important; }
      #pv { position: absolute; left: 0; top: 0; width: 1920px; height: 1080px; object-fit: cover; }
      #scrim { position: absolute; inset: 0; background: rgba(0,0,0,0.35); }

      /* data family v2: dashboard window over dimmed footage */
      #scrim { background: rgba(4,6,12,0.58) !important; }
      .win { position: absolute; border-radius: 26px; background: rgba(11,15,25,0.94); border: 2px solid rgba(255,255,255,0.16); box-shadow: 0 30px 80px rgba(0,0,0,0.55); overflow: hidden; font-family: "Inter", "Montserrat", sans-serif; }
      .win .bar { position: absolute; left: 0; right: 0; top: 0; height: 64px; background: rgba(255,255,255,0.06); border-bottom: 2px solid rgba(255,255,255,0.10); display: flex; align-items: center; padding-left: 28px; gap: 12px; color: #aab3c5; font-size: 24px; font-weight: 500; }
      .win .bar i { width: 16px; height: 16px; border-radius: 50%; background: #ff5f57; display: block; }
      .win .bar i:nth-child(2) { background: #febc2e; } .win .bar i:nth-child(3) { background: #28c840; }
      .win .bar b { margin-left: 18px; font-weight: 500; }
      .chip { position: absolute; font-family: "Inter", "Montserrat", sans-serif; font-weight: 700; font-size: 26px; padding: 8px 20px; border-radius: 999px; background: rgba(255,210,63,0.14); border: 2px solid #ffd23f; color: #ffd23f; white-space: nowrap; }
    </style>
  </head>
  <body>
    <div id="root" data-composition-id="main" data-start="0" data-duration="5" data-fps="24" data-width="1920" data-height="1080">
      <div id="plate"><div id="world"><video id="pv" src="plate.mp4" muted playsinline data-start="0" data-duration="5"></video><div id="scrim"></div><div class="blob b1" id="b1"></div><div class="blob b2" id="b2"></div><div class="grid"></div></div></div>
      <div id="panel"></div>
      <div id="ttl">Four runs in a row, seconds</div>
      <div id="chipx" class="chip" style="left:190px;top:900px;z-index:8">Measured by us, 2026</div>
      <div id="legend"></div>
      <svg id="chart" viewBox="0 0 1920 1080"></svg>
      <div id="dyn"></div>
    </div>
    <script>
      window.__timelines = window.__timelines || {};
      (function () {
        const v = window.__hyperframes.getVariables();
        const tl = gsap.timeline({ paused: true });
        if (!v.plate) document.getElementById("plate").style.display = "none";

        const NS = "http://www.w3.org/2000/svg";
        const svg = document.getElementById("chart");
        const dyn = document.getElementById("dyn");
        const X0 = 400, DXP = 420, BASE = 790, SPAN = 470;
        const steep = v.data === "steep";
        const RAW = steep ? { max: 64, a: [33.62, 31.21, 34.79, 59.91], b: [20.78, 19.35, 40.51, 40.64], na: "auto-editor 8%, clip C", nb: "Whisper base.en, clip B" }
          : { max: 240, a: [206.61, 212.97, 217.24, 223.81], b: [183.21, 173.6, 173.05, 179.74], na: "Remotion TikTok template", nb: "HyperFrames overlay" };
        const A = RAW.a.map((x) => x / RAW.max), B = RAW.b.map((x) => x / RAW.max);
        if (steep) document.getElementById("ttl").textContent = "Four runs in a row, seconds";
        const line = (x1, y1, x2, y2, col, w, op) => { const l = document.createElementNS(NS, "line"); l.setAttribute("x1", x1); l.setAttribute("y1", y1); l.setAttribute("x2", x2); l.setAttribute("y2", y2); l.setAttribute("stroke", col); l.setAttribute("stroke-width", w); l.setAttribute("stroke-opacity", op); svg.appendChild(l); return l; };
        // faint grid, baseline axis, x labels
        for (let g = 0; g <= 4; g++) { const ax = document.createElement("div"); ax.className = "xl"; ax.style.cssText = "width:120px;text-align:right;left:130px;top:" + (BASE - g * (SPAN / 4) - 17) + "px;font-size:22px;color:#94a3b8"; ax.textContent = Math.round(g * RAW.max / 4) + " s"; dyn.appendChild(ax); }
        for (let g = 1; g <= 4; g++) line(250, BASE - g * (SPAN / 4), 1670, BASE - g * (SPAN / 4), "#ffffff", 2, 0.07);
        line(250, BASE, 1670, BASE, "#94a3b8", 3, 1);
        for (let i = 0; i < 4; i++) {
          const l = document.createElement("div"); l.className = "xl"; l.style.left = (X0 + i * DXP - 100) + "px"; l.textContent = ["Run 1, cold", "Run 2", "Run 3", "Run 4"][i];
          dyn.appendChild(l);
        }
        // legend
        const series = [{ raw: RAW.a, vals: A, col: v.color1, name: RAW.na, pill: "above", t0: 0.5 }];
        if (v.showSecond) series.push({ raw: RAW.b, vals: B, col: v.color2, name: RAW.nb, pill: "below", t0: 0.7 });
        const legend = document.getElementById("legend");
        series.forEach((s) => { const d = document.createElement("div"); d.className = "lg"; d.innerHTML = '<i style="background:' + s.col + '"></i><span>' + s.name + "</span>"; legend.appendChild(d); });

        const T = 2.5;
        const fadeTargets = [];
        series.forEach((s, si) => {
          const pts = s.vals.map((val, i) => [X0 + i * DXP, BASE - val * SPAN]);
          const segs = [];
          let total = 0;
          for (let i = 1; i < pts.length; i++) { const L = Math.hypot(pts[i][0] - pts[i - 1][0], pts[i][1] - pts[i - 1][1]); segs.push(L); total += L; }
          const path = document.createElementNS(NS, "path");
          path.setAttribute("d", "M " + pts.map((p) => p[0] + " " + p[1]).join(" L "));
          path.setAttribute("fill", "none"); path.setAttribute("stroke", s.col); path.setAttribute("stroke-width", 9);
          path.setAttribute("stroke-linecap", "round"); path.setAttribute("stroke-linejoin", "round");
          const len = Math.ceil(total) + 4;
          path.style.strokeDasharray = len; path.style.strokeDashoffset = len;
          svg.appendChild(path);
          tl.to(path, { strokeDashoffset: 0, duration: T, ease: "none" }, s.t0);
          fadeTargets.push(path);
          // value label that rides the draw front
          const pill = document.createElement("div");
          pill.className = "pill"; pill.id = "pill" + si; pill.style.borderColor = s.col; pill.textContent = s.raw[0].toFixed(1) + " s";
          pill.style.left = (pts[0][0] - 105) + "px";
          pill.style.top = (s.pill === "above" ? pts[0][1] - 20 - 52 : pts[0][1] + 20) + "px";
          dyn.appendChild(pill);
          fadeTargets.push(pill);
          tl.to(pill, { opacity: 1, duration: 0.2, ease: "power1.out" }, s.t0 - 0.05);
          let t = s.t0;
          pts.forEach((p, i) => {
            const dot = document.createElement("div");
            dot.className = "dot"; dot.id = "dot" + si + "_" + i;
            dot.style.left = (p[0] - 12) + "px"; dot.style.top = (p[1] - 12) + "px"; dot.style.background = s.col;
            dyn.appendChild(dot);
            fadeTargets.push(dot);
            tl.set(dot, { scale: 0 }, 0);
            tl.to(dot, { scale: 1, duration: 0.32, ease: "back.out(3)" }, t);
            if (i > 0) tl.set(pill, { textContent: s.raw[i].toFixed(1) + " s" }, t);
            if (i < segs.length) {
              const dur = T * segs[i] / total;
              tl.to(pill, { x: pts[i + 1][0] - pts[0][0], y: pts[i + 1][1] - pts[0][1], duration: dur, ease: "none" }, t);
              t += dur;
            }
          });
        });
        // clear the chart so the loop restarts on the bare axes
        tl.to(fadeTargets, { opacity: 0, duration: 0.35, ease: "power1.in" }, 4.5);

        window.__timelines["main"] = tl;
      })();
    </script>
  </body>
</html>
With Remotion
We have not built this effect in Remotion. If you use it, read its licence first: Individuals (personal or commercial use), organisations or teams with a total headcount of 3 or less, non-profits, and anyone evaluating Remotion before commercial use. A company does not qualify merely because it is unprofitable. Everyone not eligible for the Free License needs a Company License. Remotion licence FAQ, checked Nov 4, 2026.
In your editor: Premiere, Resolve, After Effects, CapCut
We have not reviewed an editor template for this effect yet.
Variations
The same composition rendered again with different settings. Nothing was rebuilt.
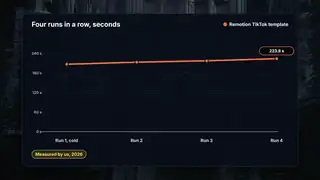
{"showSecond":false}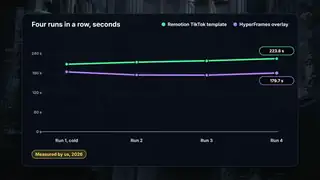
{"color1":"#2ee59d","color2":"#b18cff"}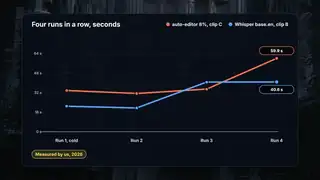
{"data":"steep"}Spec and test details
- Engine
- HyperFrames 0.8.10, GSAP 3.14.2 (local copy)
- Length and frame rate
- 5 seconds at 24 fps, rendered at 1920x1080
- Video files on this page
- H.264: 1920x1080 for Expand (1890.6 KB), 1280x720 in the page (566.3 KB), 640x360 in galleries (135.4 KB), no audio
- Picture check
- The 1080p file scores VMAF 97.78 against our render master and keeps 100% of its edge detail (measured by us with FFmpeg libvmaf and OpenCV)
- Footage
- wide cathedral interior with organ pipes, a figure hanging on a rope, cool light (Tears of Steel, 2:32)
- Tested in editors
- None yet
- Flash check
- Passed: at most 0 general and 0 red flashes in any second. automated approximation of WCAG 2.3.1 on a 96x54 grid, whole loop including the restart; not a certification.
- Licence
- Composition adapted by us from the HyperFrames registry (Apache-2.0); text fonts from Google Fonts under the SIL Open Font License.
- Last tested
- Nov 14, 2026
- Machine
- Laptop: AMD Ryzen 7 7735U (8 cores, 16 threads), 31 GB RAM, Windows 11 Home; CPU rendering
Technical details: render times and file sizes
- Render of the 5-second master: 69.6 s (2 render workers, on the laptop above).
- full.mp4: 1890.6 KB
- hero.mp4: 566.3 KB
- hero.webp: 30.8 KB
- tile.mp4: 135.4 KB
- tile.webp: 10.3 KB
- Variation "single": rendered in 77.8 s, 122.9 KB
- Variation "two": rendered in 69.7 s, 132.9 KB
- Variation "steep": rendered in 95.2 s, 141.5 KB
Credits
- Built from the HyperFrames registry block mk-line-graph by HeyGen (Apache-2.0), adapted by us.
- Fonts from Google Fonts, under the SIL Open Font License.
- Footage: Tears of Steel, (c) Blender Foundation, mango.blender.org, licensed CC-BY 3.0. We cropped the shots to 16:9 and laid our graphics over them.
- Editor templates and other routes on this page belong to their creators, who are credited on each card.
Related effects and jobs
Page checked on Nov 4, 2026.